The 2011 Census of Population on language in Canada was released in October of this year. The census revealed some interesting statistics about the Tamil community.
Highlights:
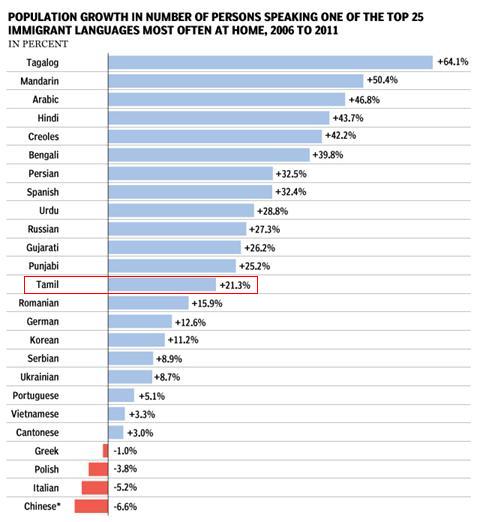
- Tamil population of Canada is 143,000. Tamil is the 16th largest immigrant language group in Canada.
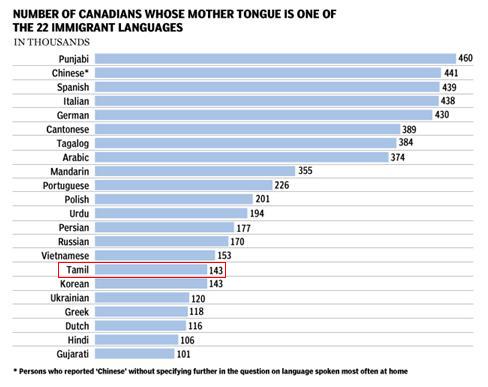
- % increase in Tamil population from 2006 to 2011 was 21.3%. Tamil had the 13th highest immigrant language growth in Canada.
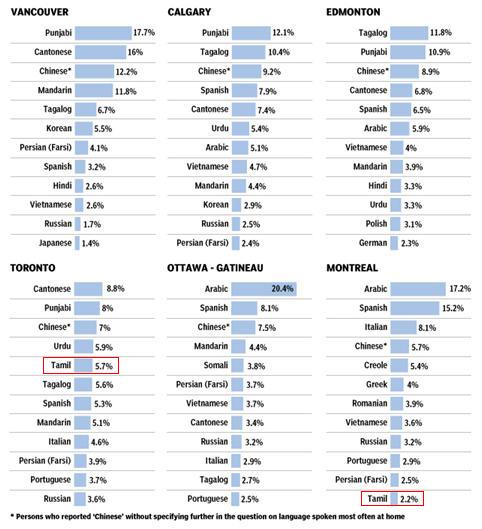
- Tamil population of Toronto is 102,700 (5.7% of Toronto). It is the 5th most spoken non-official language in Toronto.
- Tamil population of Montreal is 13,730 (2.2% of Montreal). It is the 12th most spoken non-official language in Montreal.
- Tamil is not among the top 12 languages in any other city in Canada. Unlike most language groups, Tamils are extremely concentrated in Toronto.
What does this foreshadow for the Tamil community in Canada?
Canadian immigration statistics reveal a steady decline in immigrants from Sri Lanka since peaking in 1992-1995. In 2011, immigrants from Sri Lanka totaled just 3,104, the lowest total since 1989. Sri Lanka ranked 18th in top immigrant source countries, between Egypt and Nigeria.
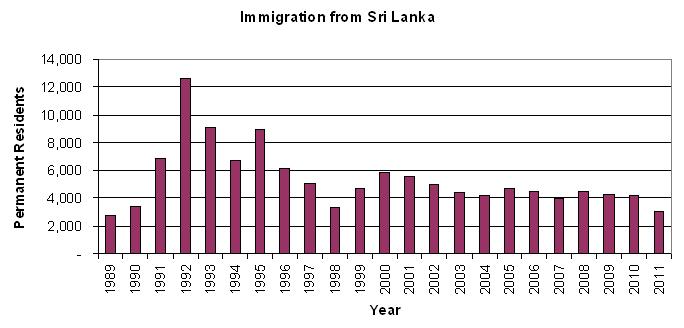
What accounts for this decline? The cessation of hostilities in Sri Lanka has resulted in a sharp drop in refugee claimants and acceptance. Family-class chain migration (sponsoring of spouses, parents, grandparents, and children) has also slowed. Unlike working-class new immigrant Tamils in the 90s – most of whom went “back home” to sponsor wives from Sri Lanka – the first generation Tamil-Canadians of marriageable age are likely to seek spouses within Canada.
In addition to immigration, another source of population is natural growth – the difference between births and deaths. While birth rates for Tamil-Canadians are not available, anecdotally one can surmise that birth rates are low, particularly among the young professional class. Many Tamil-Canadians remain unmarried and childless into their 30s, and the combination of increasing bachelors and bachelorettes – coupled with late marriage and a large proportion of women in the workforce – suggest that Tamil fertility rates resemble the general Canadian population (below the replacement level fertility rate of 2.1 births per woman).
Thus, the demographic “double whammy” of decreased immigration and low birth rates indicate the Tamil population in Canada will grow slowly moving forward. This is in sharp contrast to fast-growing immigrant languages like Tagalog, Mandarin and Arabic, all of which have a pool of 100 million+ speakers worldwide to draw from (by contrast, the Tamil population of Sri Lanka is just 2.2 million).
It is likely that Tamil population characteristics will most resemble the Vietnamese community going forward. Like Tamil-Canadians, Vietnamese-Canadians arrived predominantly as refugees in the late 1970s and early 80s (the original “boat people”) and a decade before the Tamil refugee wave.
In 1979, Canada welcomed 19,859 immigrants from Vietnam. In 1980, Canada welcomed another 25,541. Vietnam remained among the top 10 immigrant source countries through the 1980s and early 90s, only falling out of the top 10 in 1995. Similarly, Canada welcomed 12,635 immigrants from Sri Lanka in 1992 and 9,103 in 1993 – the two peak years of Tamil immigration. Sri Lanka remained among the top 10 immigrant source countries from 1990 to 2003.
Yet by 2011, Sri Lanka had fallen to 18th in rank. Similarly, Vietnam had fallen to 32nd. Furthermore, the Vietnamese population grew by just 3.3% between 2006 and 2011. It is likely that Tamils will experience similar slow growth in the upcoming census.
Thus, just as the waves of Japanese, Greeks, Poles, Italians, and Vietnamese immigrants that preceded us, the Tamil community will gradually blend into the broader Canadian mosaic. The combination of decreased immigration, low birth rates, growing inter-ethnic marriage, and loss of language retention will likely mean the Tamil-Canadian community will grow slowly and even decline in the not too distant future.
Graphics c/o National Post

 Sen
Sen


